Cross-cultural comparative study
Learning Objective: In this activity you will learn how to generate an understanding of human behavior that goes beyond random facts, anecdotes, and unsupported assumptions. Learning how to investigate past human behavior with the comparative method is a skill that is useful in many careers and jobs. Through creating a research design, working with primary data, and statistically analyzing your results, you will improve your ability to design future research and create new knowledge in other domains. You will also gain a depth of understanding of at least ten cultures, use some of the key terms you learned, and further develop your anthropological perspective on the world.
Procedure:
First, make note of a question you have about one aspect of the issues we discuss in class and/or are discussed in your readings. Your question will probably concern some perceived pattern or relationship. For example, you might wonder if there is a relationship between the type of subsistence system a culture relies on and the extent of inequality within that culture. Now, time to research the issue. What is known about the factors affecting the emergence of inequality and subsistence systems? Has anyone else investigated the relationship you are interested in? Look at journal articles rather than just books as journal articles are more up-to-date. If you are having trouble thinking of a topic and question to research, read about previous cross cultural studies. Search within Anthropology Journals (especially Anthropological Literature: ANL link).
Carefully consider if there is any reason why subsistence systems and inequality might be related; that is, that one might affect the other (this is very important!). If you cannot think of a reason (or find one in the published literature on the subject), then you don't have a "mechanism" (and one might not exist). Without a plausible mechanism for an actual relationship between the phenomena, your research is likely to be unproductive or result in temporal correlations, not possible causal relationships.
Second, formulate your question into a testable hypothesis. An hypothesis is an educated (based on your preliminary research) guess that will guide your investigation. Testable means both that the proposition is in principle amenable to verification by empirical knowledge, or evidence, and that a sufficient amount of such evidence is at hand.
Third, collect data to test your hypothesis. This is where you will use the eHRAF database (Archaeology or World Cultures). Choose between approximately 10 traditions/cultures that seem to be appropriate to test your hypothesis. For example, given the relationship above, you would probably want 5 randomly selected agricultural societies and 5 randomly select hunter/gatherer societies. For each of the 10 societies, examine the extent of inequality. You can code inequality on a scale of 1 to 5 or low, medium, high -- as long as you develop a description for each code. Don't foget to record where you found the data because you will need to cite your sources in your data table. NOTE: It is usually not sufficient to rely upon eHRAF culture summaries as data sources. Use eHRAF primary sources only.
Please note that there is a detailed text, Basic Guide to Cross-Cultural Research on-line.
Click here for some specific instructions on a step-by-step method of investigating the relationship between ancestor worship and monumental architecture. This example will help you conduct similar analyses.
Fourth, does the evidence support your hypothesis? You may or may not find support for your hypothesis. That doesn't matter; the data are what they are. You should be able to say something like the evidence provides [strong, moderate, weak, no] support for your hypothesis. Statistical analysis and inference are stronger than descriptive statistics.
Finally, offer an explanation of your findings. Why do you think the evidence points in the direction it does? Given the direction of the evidence, why do you think the relationship you proposed might be supported (or why do you think your original hunch was wrong)?
Your report must be structured with the following identified (use these headings in your paper) sections. There is some redundancy among the sections on what information should be covered in each; so, you will need to decide, as the author, where/if repetition is necessary to help a reader understand your study. Also, don't forget to review the report evaluation criteria below.
1. Introduction (1-2 paragraphs):
2. Background (1-2 paragraphs):
3. Expectations (1-2 paragraphs):
4. Mechanisms (1-2 paragraphs)
5. Research Design and Methods (1-3 paragraphs):
6. Results (1-4 paragraphs; will vary by research question):
7. Discussion (2-3 paragraphs):
8. Conclusion (1-2 paragraphs):
9. References cited:
10. Appendix: Data table and coding sheet:
The paper should be between 5 and 8 double-spaced pages long, excluding tables and figures. Please submit as a Microsoft Word document or pdf. The report may be submitted as late as 6 pm on the last day of the block. 10% of the total point value will be deducted for a late submission.
Below is the rubric I use to evaluate research reports. Rubrics are designed to clarify expectations and signal where you are with your progress toward meeting the learning objectives of the assignment.
27-30 points: The final report is an exceptional example of a first cross-cultural comparative study. A very strong understanding of cross-cultural comparative methods is demonstrated. The report is clearly written and understandable by an audience that is not familiar with cross-cultural research methods. The report is pleasing to read and the results make progress in understanding factors that influence human cultural and/or behavioral diversity. The format specified above was precisely followed and complete.
24-26.9 points: The final report is strong example of a first cross-cultural comparative study. A strong understanding of cross-cultural comparative methods is demonstrated. The report is clearly written and mostly understandable by an audience that is not familiar with cross-cultural research methods. The report is easy to read and the results make progress in understanding factors that influence human cultural and/or behavioral diversity. The format specified above was followed and complete.
21-23.9 points: The final report is a weak example of a first cross-cultural comparative study. A limited understanding of cross-cultural comparative methods is demonstrated. The report is unevenly written and likely confusing to an audience that is not familiar with cross-cultural research methods. The report is challenging to read and the results make little progress in understanding factors that influence human cultural and/or behavioral diversity. The format specified above was poorly followed and not fully complete.
< 21 points: The cross-cultural comparative study does not meet most expectations based on the criteria above.
Procedure:
First, make note of a question you have about one aspect of the issues we discuss in class and/or are discussed in your readings. Your question will probably concern some perceived pattern or relationship. For example, you might wonder if there is a relationship between the type of subsistence system a culture relies on and the extent of inequality within that culture. Now, time to research the issue. What is known about the factors affecting the emergence of inequality and subsistence systems? Has anyone else investigated the relationship you are interested in? Look at journal articles rather than just books as journal articles are more up-to-date. If you are having trouble thinking of a topic and question to research, read about previous cross cultural studies. Search within Anthropology Journals (especially Anthropological Literature: ANL link).
Carefully consider if there is any reason why subsistence systems and inequality might be related; that is, that one might affect the other (this is very important!). If you cannot think of a reason (or find one in the published literature on the subject), then you don't have a "mechanism" (and one might not exist). Without a plausible mechanism for an actual relationship between the phenomena, your research is likely to be unproductive or result in temporal correlations, not possible causal relationships.
Second, formulate your question into a testable hypothesis. An hypothesis is an educated (based on your preliminary research) guess that will guide your investigation. Testable means both that the proposition is in principle amenable to verification by empirical knowledge, or evidence, and that a sufficient amount of such evidence is at hand.
Third, collect data to test your hypothesis. This is where you will use the eHRAF database (Archaeology or World Cultures). Choose between approximately 10 traditions/cultures that seem to be appropriate to test your hypothesis. For example, given the relationship above, you would probably want 5 randomly selected agricultural societies and 5 randomly select hunter/gatherer societies. For each of the 10 societies, examine the extent of inequality. You can code inequality on a scale of 1 to 5 or low, medium, high -- as long as you develop a description for each code. Don't foget to record where you found the data because you will need to cite your sources in your data table. NOTE: It is usually not sufficient to rely upon eHRAF culture summaries as data sources. Use eHRAF primary sources only.
Please note that there is a detailed text, Basic Guide to Cross-Cultural Research on-line.
Click here for some specific instructions on a step-by-step method of investigating the relationship between ancestor worship and monumental architecture. This example will help you conduct similar analyses.
Fourth, does the evidence support your hypothesis? You may or may not find support for your hypothesis. That doesn't matter; the data are what they are. You should be able to say something like the evidence provides [strong, moderate, weak, no] support for your hypothesis. Statistical analysis and inference are stronger than descriptive statistics.
Finally, offer an explanation of your findings. Why do you think the evidence points in the direction it does? Given the direction of the evidence, why do you think the relationship you proposed might be supported (or why do you think your original hunch was wrong)?
Your report must be structured with the following identified (use these headings in your paper) sections. There is some redundancy among the sections on what information should be covered in each; so, you will need to decide, as the author, where/if repetition is necessary to help a reader understand your study. Also, don't forget to review the report evaluation criteria below.
1. Introduction (1-2 paragraphs):
- Please include your research question, hypothesis, a brief statement of your results (your central claim), and some general information to orient and excite your reader about your investigation. Don't hesitate to use easy to follow sentences like, "The purpose of this report is to..." or "This report considers x to better understand y. I make two arguments: first...second..."
- Tell the reader why your investigation is important to our understanding of human and/or cultural diversity and variation.
2. Background (1-2 paragraphs):
- Please define your terms (e.g., ancestor worship and monumental architecture) and summarize what other researchers have found in similar investigations. Cite your sources using a consistent format: (author last name year:page number)---(Ingram 2013:24-28). Please note that whenever you use the ideas or words of others, you must place a citation to that author/source in your text. Otherwise, you will be committing plagarism (a violation of the University's Honor Code). If an idea or another type of information is not common knowledge, a citation must be provided. See the CC Psychology Department's information on avoiding plagiarism.
- The purpose of the background section is to give the reader sufficient information to understand your research question, etc. and to situate your research in the context of other similar research. For example, the Background section is the place to describe published studies similar to your study. fi your study is unique your variables are likely not. What have other studies found regarding why your dependent variable varies?
- Don't forget to identify the time period/s you are investigating in each culture/tradition.
3. Expectations (1-2 paragraphs):
- Describe what you expect to find in the data if your hypothesis is supported/not supported. What kind of relationship do you expect (positive, negative, or no relationship)? Sample sentences you can use: "My hypothesis will be supported if I find..." My hypothesis will not be supported if I find..." "I expect that as x increases, y will increase."
- Remember that hypotheses are not true or false; they are either supported (or not) by the data you consider.
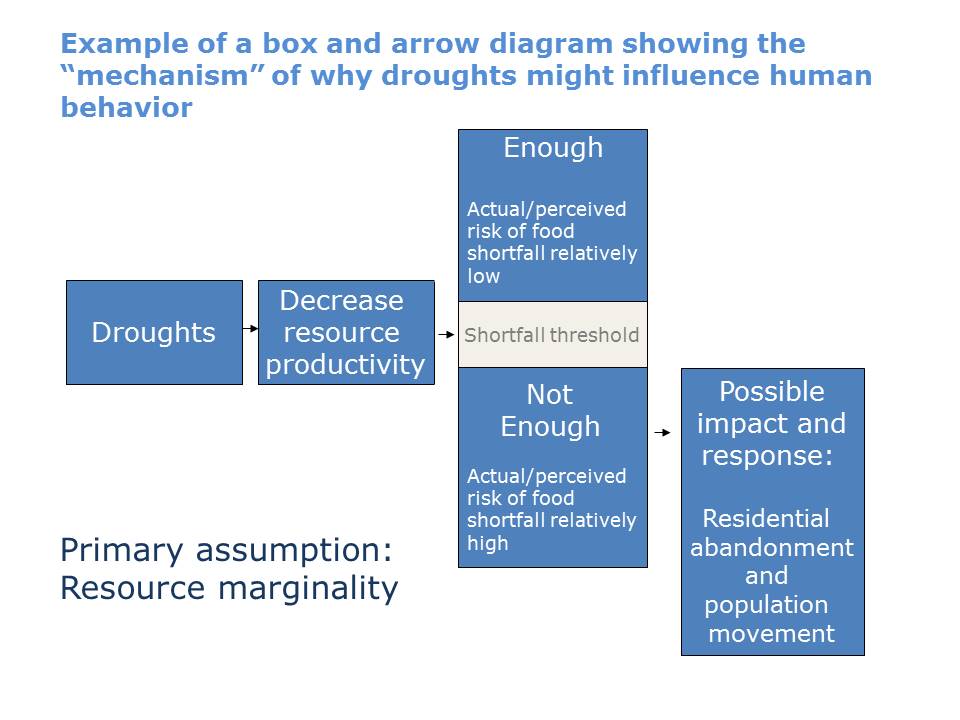
4. Mechanisms (1-2 paragraphs)
- Discuss why it is reasonable to expect a relationship between your variables (e.g., why would ancestor worship influence decisions to build monumental architecture?). Avoid investigating relationships between variables in which there is no reasonable mechanism of influence of the independent variable on the dependent variable. For example, it makes no sense to investigate the influence of ancestor worship (independent variable) on the presence/absence of early metal tools (dependent variable).
- Create one or more box and arrow diagrams that identify the relationship between the variables and the direction of assumed causality. I recommend a separate box and arrow diagram for each independent variable. Note that the mechanisms that describe what would happen if the independent variable is "high" might be different than what would happen if the independent variable is low. Insert the figure/s into your text in this section. Click here to view a sample diagram.
- For a better understanding of causal mechanisms, watch the video at the bottom of this page (click here) and look at the spurious correlations on the page.
5. Research Design and Methods (1-3 paragraphs):
- Describe how you conducted your research. Please provide enough information so the reader can evaluate whether or not your methods were sound. You will need more than, "I used eHRAF to conduct my research". This section is not a diary of your effort (e.g., "First, I looked in eHRAF but there was little information." Or, "I read 20 articles."). Provide information that will help your reader decide if your research design will yield reliable results. Use professional, simple, credibility-building language.
- Describe and defend your data coding scheme (i.e., what is the difference between a 1 and a 5?).
- Describe the pattern in the data that will support/not support your hypothesis
- Define your independent and dependent variables, if you have not already. Remember that if your dependent variable does not vary you do not have an appropriate research design. For example, it doesn't make sense to investigate the influence of agriculture on religion because all early "civilizations" practiced agriculture and some form of religion---thus, the variables don't vary. (You could, however, narrowly define agriculture and religion to develop an effective research design.)
- Describe and defend your sample---why are the cultures/traditions you used to investigate the relationships appropriate for answering your research question? The quality and type of your sample will determine the generalizability of your results.
- Describe and defend the statistic you will use to test your hypothesis.
6. Results (1-4 paragraphs; will vary by research question):
- Support the written description of your results with contingency or data tables and/or figures and describe and interpret what the reader will see in the tables/figures. Tell the reader if your hypothesis was supported (accepted) or not (rejected). Report the results of your statistical analyses. Most tables/figures to support your results should be in the body of your text. Some may be placed in your appendix. The data table in part 10 contains all your data; a simplified version can be used in the body of your text. The data table in this section should summarize the data so that the reader can see how/if your results support your hypothesis.
- Data tables must contain citations to where the data in the table came from. This can be accomplished by adding a column that contains the citation (and adding something like, "Smith 2011" to a table cell). A citation of "eHRAF" is not sufficient -- there is usually an author listed on the eHRAF page where you are getting your data. If you have data from seven cultures in a table, you will have at least seven citations in the table.
- All tables/figures should be named (e.g., Table 1. Description of Monumental Architecture in Early Civilizations) and referred to in the text (e.g., "see Table 1). Note that there is a difference between figures and tables.
- All x/y plots must have axis labels so a reader can understand the figure.
7. Discussion (2-3 paragraphs):
- Please tell the reader why you think your results are the way they are.
- Use this section to critique your research design. How could it be improved to yield better results? If you can't fix certain problems in your study, it is best to disclose them here.
- You can also use this section to provide additional insights for your reader on potential patterns in the relationship/no relationship between your variables.
8. Conclusion (1-2 paragraphs):
- Summarize the most important insights you want your readers to remember after reading your report.
9. References cited:
- List in a consistent bibliographic format (Chicago, MLA, APA, etc.) the sources (articles, books, reports---mostly peer-reviewed!) you have relied on. The list of references cited should not be included in the page count (5-8 pages) of your report. Use a complete bibliographic format.
10. Appendix: Data table and coding sheet:
- Include the data table/s and/or coding sheet you used to collect your cross-cultural data.
The paper should be between 5 and 8 double-spaced pages long, excluding tables and figures. Please submit as a Microsoft Word document or pdf. The report may be submitted as late as 6 pm on the last day of the block. 10% of the total point value will be deducted for a late submission.
Below is the rubric I use to evaluate research reports. Rubrics are designed to clarify expectations and signal where you are with your progress toward meeting the learning objectives of the assignment.
27-30 points: The final report is an exceptional example of a first cross-cultural comparative study. A very strong understanding of cross-cultural comparative methods is demonstrated. The report is clearly written and understandable by an audience that is not familiar with cross-cultural research methods. The report is pleasing to read and the results make progress in understanding factors that influence human cultural and/or behavioral diversity. The format specified above was precisely followed and complete.
24-26.9 points: The final report is strong example of a first cross-cultural comparative study. A strong understanding of cross-cultural comparative methods is demonstrated. The report is clearly written and mostly understandable by an audience that is not familiar with cross-cultural research methods. The report is easy to read and the results make progress in understanding factors that influence human cultural and/or behavioral diversity. The format specified above was followed and complete.
21-23.9 points: The final report is a weak example of a first cross-cultural comparative study. A limited understanding of cross-cultural comparative methods is demonstrated. The report is unevenly written and likely confusing to an audience that is not familiar with cross-cultural research methods. The report is challenging to read and the results make little progress in understanding factors that influence human cultural and/or behavioral diversity. The format specified above was poorly followed and not fully complete.
< 21 points: The cross-cultural comparative study does not meet most expectations based on the criteria above.
The idea for this activity was inspired by and adapted from the eHRAF website and developed by Vicki Bentley-Condit, Department of Anthropology, Grinnell College, IA. The description of the parts of a research report and the rubric were developed by Ingram.
