Activity: Investigating a research problem; identifying a "mechanism"
Please read the instructions for the Quantitative Research Project: Climate and Human Behavior. Your submission for this activity may be applied to this project. Instructions for completing this activity will be presented in class.
For this activity, please write the first four paragraphs of the Research Project. The instructions are repeated below.
1. Introduction (1 to 2 paragraphs)
2. Background (1 - 2 paragraphs)
3. Expectations (1 paragraph)
4. Mechanisms (1 paragraph)
This activity should require no more than 2, double-spaced pages. Separate the four sections by separate headings (Introduction, Background, Expectations, Mechanisms). This helps the reader follow the flow of your emerging argument. Please carefully proof read your document. Grammatical and spelling errors threaten understanding. Readers are not convinced by what they don't understand. Upload the activity on Blackboard, as usual.
Assessment criteria click here.
For this activity, please write the first four paragraphs of the Research Project. The instructions are repeated below.
1. Introduction (1 to 2 paragraphs)
- Please include your research question, hypothesis, a brief statement of your results, and some general information to orient and excite your reader about your investigation. Don't hesitate to use easy to follow sentences like, "The purpose of this report is to..." or "This report considers x (independent variable) to better understand y (dependent variable). I make two arguments: first...second..."
- Your research question involves only the data provided on the project page. A simple way to state your question is: "What was the influence of x (independent variable, such as drought severity) on y (dependent variable, such as the percent of rooms abandoned during the period of study, 1200 to 1450). Thus, a reasonable research question is, "What was the influence of drought severity on changes in the percent of rooms abandoned during the 1200 to 1450 period?" Another research question is, "What was the influence of drought severity on changes in the number of archaeologically identified rooms." I recommend you select one of these two questions to investigate.
- Tell the reader why your investigation is important to our understanding of the past.
2. Background (1 - 2 paragraphs)
- Please identify and define your your dependent variable (what you are trying to explain) and independent variable (what you think might explain variation in your dependent variable). Define what these variables represent. For example, if you're using the number of archaeologically identified rooms as a dependent variable, then this is an indicator of relative changes in human population levels. The percent of each 50-year interval identified as a drought is an indicator of relative differences in the dryness of each period. The greater the dryness, the lesser the agricultural productivity.
- The purpose of the background section is to give the reader sufficient information to understand your research question and to situate your research in the context of other similar research. In this assignment, however, you do not need to investigate the scientific literature on the potential relationship between your variables. Make your best guess on why the question and answer might be important to the scientific community and the public.
- Don't forget to tell the reader what a watershed is and what a drought is.
- For your information, the people living in the place during this period did not have domesticated cows, oxen, etc. to assist with farming.
3. Expectations (1 paragraph)
- Describe what you expect to find in the data if your hypothesis is supported/not supported. What kind of relationship do you expect (positive, negative, or no relationship)? Sample sentences you can use: "My hypothesis will be supported if I find..." My hypothesis will not be supported if I find..." "I expect that as x increases, y will increase."
4. Mechanisms (1 paragraph)
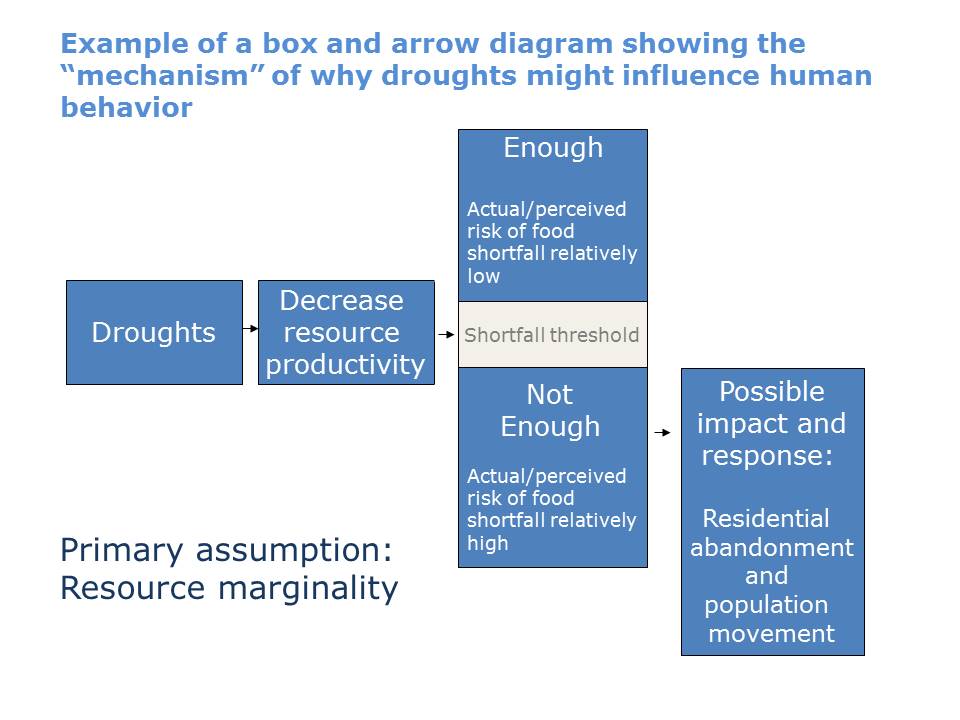
- Discuss why it is reasonable to expect a relationship between your variables (e.g., why would population density affect abandonment rates?). Avoid investigating relationships between variables in which there is no reasonable mechanism of influence of the independent variable on the dependent variable. For example, it makes no sense to investigate the influence of population density on the percent of a period identified as a drought because atmospheric processes explain variation in drought frequency, not population density (at least in the past).
- Create a box and arrow diagram that identifies the relationship between the variables and the direction of assumed causality. Insert the figure into your text in this section. You will likely need at least one box between your independent variable (the left-most box) and your dependent variable (your right-most box) to explain the relationship between the variables you are investigating. Click here to see an example of a box-and-arrow diagram that presents a mechanism. Please don't duplicate this figure in your report.
- For a better understanding of causal mechanisms, watch the video at the bottom of this page (click here) and look at the spurious correlations on the page.
This activity should require no more than 2, double-spaced pages. Separate the four sections by separate headings (Introduction, Background, Expectations, Mechanisms). This helps the reader follow the flow of your emerging argument. Please carefully proof read your document. Grammatical and spelling errors threaten understanding. Readers are not convinced by what they don't understand. Upload the activity on Blackboard, as usual.
Assessment criteria click here.
